How to Read Candlestick Charts: A Clear Guide
How to read candlestick charts: open, high, low and close, bodies and wicks, timeframes, a few patterns that matter, and how to use candles in a tournament.
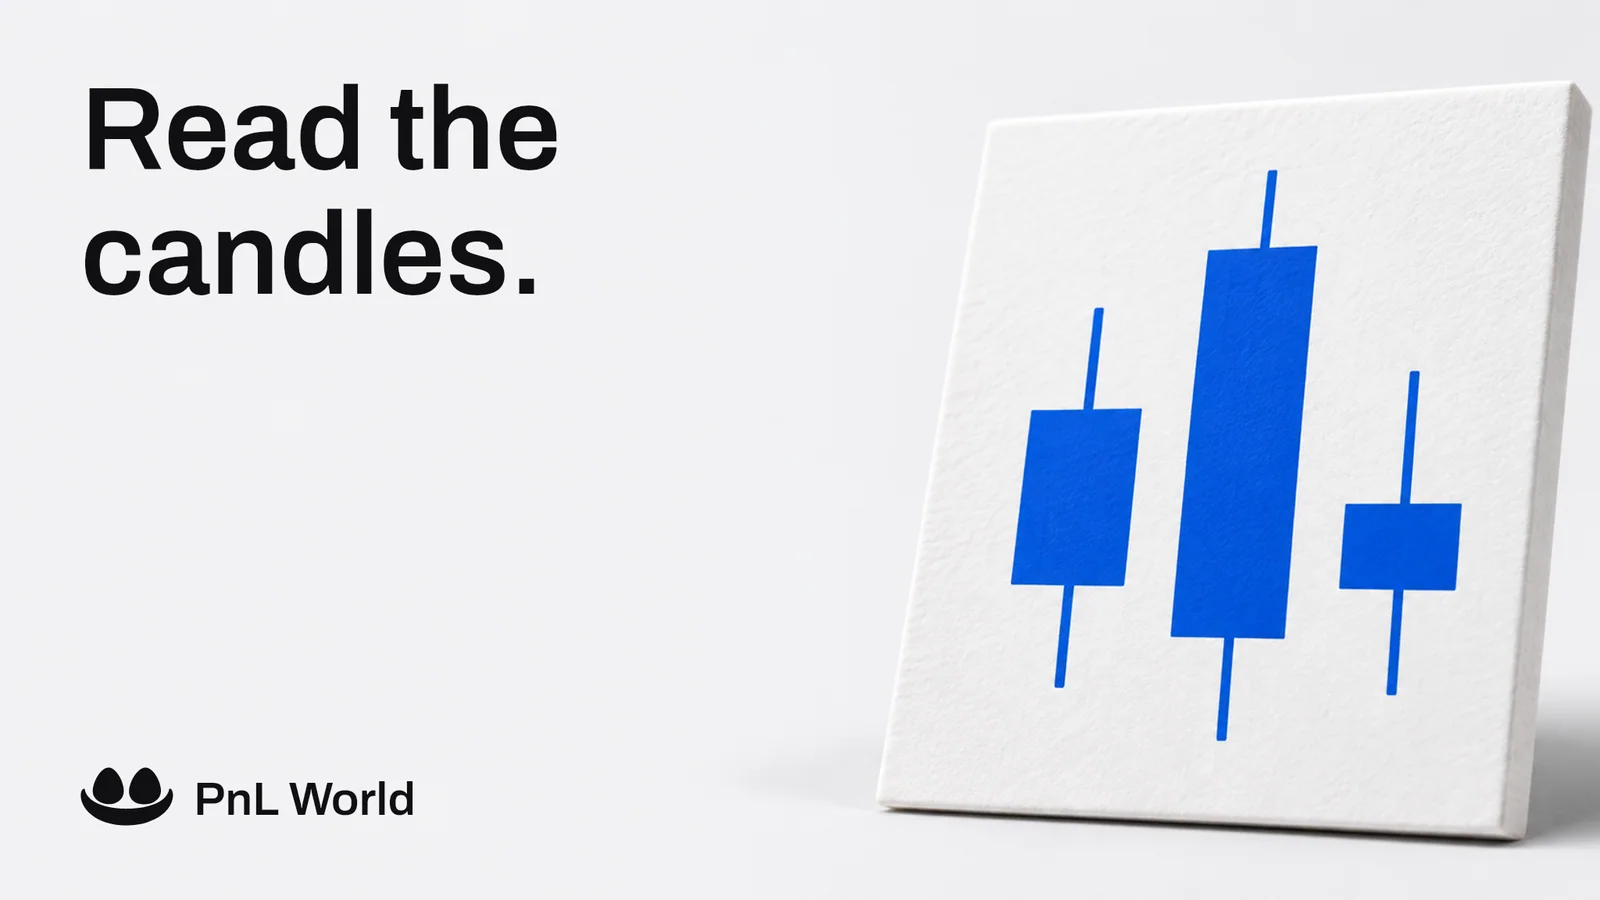
A candlestick chart shows how price moved in each period — a minute, an hour, a day. Each candle tells four prices and the story of the fight between buyers and sellers in that period.
Anatomy of a candle
| Part | Meaning |
|---|---|
| Open | Price at the start of the period |
| Close | Price at the end of the period |
| High | Highest price in the period (top of the upper wick) |
| Low | Lowest price in the period (bottom of the lower wick) |
| Body | Range between open and close |
| Wicks (shadows) | Ranges price reached but did not hold |
Green (up) candle: close above open. Red (down) candle: close below open.
What candles tell you
- Long body — one side was in control for the whole period.
- Long upper wick — buyers pushed up, sellers pushed back: rejection from above.
- Long lower wick — sellers pushed down, buyers pushed back: rejection from below.
- Small body, wicks both sides — indecision.
Timeframes
The same market looks different on a 1-minute and a daily chart. Use a higher timeframe for direction and a lower one for timing. In a 4-hour tournament, for example: daily or 4-hour for the trend, 15-minute for entries.
A few patterns worth knowing
| Pattern | What it shows | Use |
|---|---|---|
| Engulfing | A candle's body fully covers the previous one in the other direction | Possible reversal at a level |
| Pin bar / hammer | Small body with a long wick on one side | Rejection of a price area |
| Inside bar | A candle entirely within the previous one | Pause before a move |
| Doji | Open ≈ close | Indecision |
Patterns are context, not signals by themselves. They mean the most at support and resistance levels and in the direction of the higher-timeframe trend.
Candles in a trading tournament
- Wait for the candle to close before acting on a pattern; mid-candle shapes change.
- Do not chase a big candle — that is how FOMO trades start.
- Set the stop beyond the wick of the candle that triggered your entry.
- Remember fees and funding — the chart shows price, but your place is decided by the result after costs.
FAQ
What do the colours mean? Green: the period closed higher than it opened. Red: it closed lower.
Which timeframe should beginners use? Start with 1-hour and 4-hour charts; they are less noisy than 1-minute candles.
PnL World tournaments are simulated: trades are executed against live market data, but no real-money positions are opened on any exchange. Nothing here is financial advice.
Next: Support and resistance explained · Trading competitions for beginners · Long vs short